
One share.
What could it become?*
A simple way to explore a share’s future.
Try the calculator

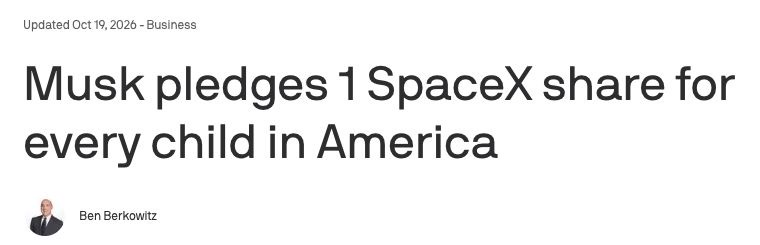

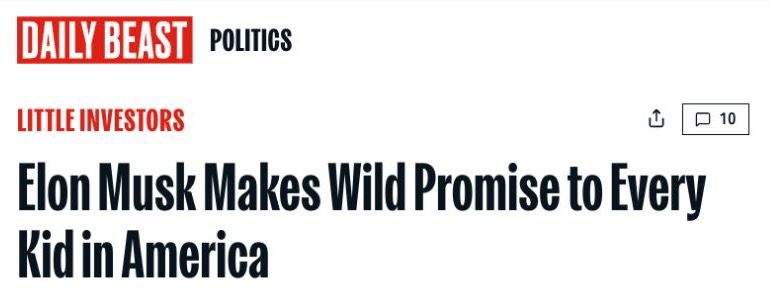
Original screenshots · captured 20 October 2026 · select to read the source
SpaceX SPCX · Nasdaq
ExpandLoading the TradingView chart. If it is unavailable, open the provider’s chart.
Provider prices may be delayed.
A future you can explore.*
Illustration · USD* Three historical reports, different methods: bank targets + independent fair values. You choose the target year. These are illustrations, not long-term forecasts or a bank consensus.
All three reports are on the chart. Choose a report for the table:
| Case | Modelled annual change | Source value · $/share | End value · USD |
|---|
Year-by-year values
Sources and calculation
Annualised rate = (source value ÷ starting price) ^ (1 ÷ years to your assumed target year) − 1. The curve repeats that rate until the selected end year. Extending past your target year is a mathematical extrapolation, not additional research.
Starting price: $146.03, a historical close reported for 16 October 2026—not a live quote. The illustration assumes shares held from today, not an announced gift date. No taxes, fees, dilution, inflation or additional purchases are modelled. All value can be lost. No child’s details are saved or sent.
The facts behind the pledge
- 1 share per child — reported pledge, not a confirmed allocation.
- About 72.1 million US children — July 2025 Census estimate, not an eligibility count. Source
- Market price — supplied by TradingView above, separate from this calculator.
New to shares? Start here.
- A piece of a business. Ownership, not a guaranteed payment.
- The value can fall. Strong earnings do not guarantee a higher price.
- Rights vary. Voting depends on the share class and account.
- Account rules matter. Selling and withdrawal rules remain unconfirmed.
- Spread your risk. One company should not be your whole plan.
A little time.
A clearer picture.†
Your favourite companies. Short stories. Original sources.
Try Pareto Frontier free